This is much more than a lesson about reading charts and graphs.
Students learn how to understand and talk about pie charts, bar charts, line graphs and pictograms, but the real value of the lesson is how naturally these visuals lead to conversation.
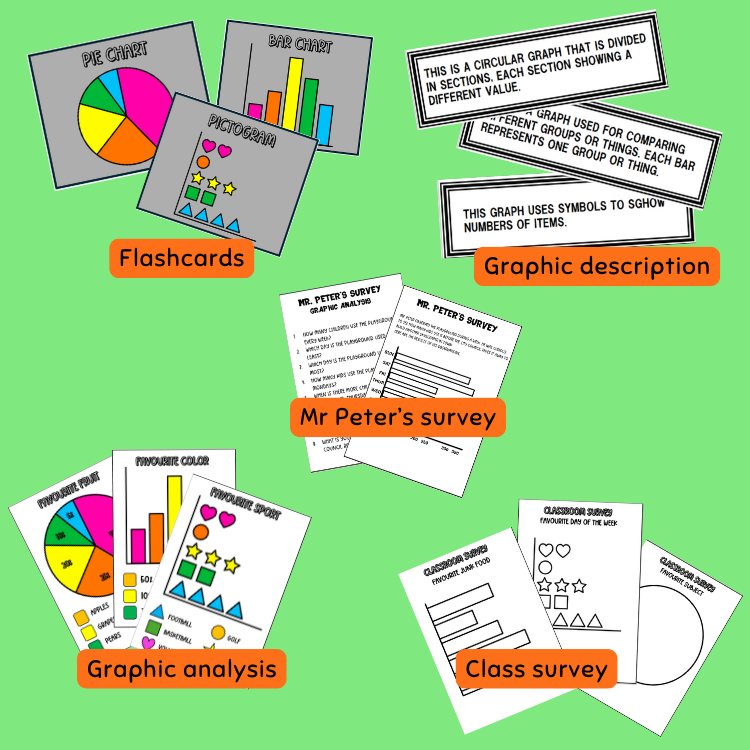
Students analyse charts about familiar topics such as favourite food, colours, pets, sports and daily temperature, explain what the information shows and compare the results. This gives them a meaningful reason to practise percentages, quantities, comparisons, preferences and opinions while speaking English.
The lesson then becomes even more interactive with a class survey. Students move around the classroom, ask their classmates questions, collect real information and use the answers to complete their own charts. Topics include favourite subjects, junk food and days of the week, making this an especially useful activity for the beginning of the school year, when students are still getting to know one another.
Students also work with a real-life style problem through Mr. Peter’s Survey, analysing playground data before discussing whether the city council should remove the playground. This takes the lesson beyond simply reading numbers and encourages students to interpret information and give their own opinions.
What’s included:
Charts and graphs vocabulary
Pie chart, bar chart, line graph and pictogram
Flashcards
Graph description matching activity
Chart and graph analysis
Speaking and interpretation tasks
Reading comprehension
Mr. Peter’s Survey
Opinion and discussion questions
Interactive classroom surveys
Student data-collection activities
Worksheets
Suggested lesson order
Teacher instructions for each activity
Perfect for upper primary and teenage ESL/EFL learners, especially for back-to-school lessons, conversation classes, CLIL-style lessons or any class where you want students to practise speaking through something more meaningful than ordinary conversation questions.
Students are not simply learning how to read a graph. They are asking questions, talking about themselves, comparing information, interpreting data and explaining what they think the results mean.